Introduction
Peptigram is a web application designed to create visualisations for peptidomics data.
Data processing
Only one input file is required for use, a CSV file, with the minimum data fields as described below. Once uploaded, the input file is processed and the extracted data is stored. Peptigram does not modify the user's data, except where required to correct for the peptide start and end positions relative to the signal peptide.
You can share or revisit jobs by copying the url of each job. Jobs older than one month will be deleted regularly.
Visualisations
For each precursor protein in the data set, two types of visualisation are created:
Peptigram workflow
Input file
The input file consists of a CSV file (other delimiters such as tabulations are also accepted).
Column names authorised
The following column names are required by Peptigram:
- Peptide sequence
-
peptide,sequence - Precursor protein ID
-
Leading razor protein,UniProt ID,protein - Peptide start
-
start position,start - Peptide end
-
end position,end - Samples intensity (multiple samples accepted)
-
intensity X,sample X, where X is the sample name
Data from MaxQuant/Andromeda
If you use MaxQuant with Andromeda
to process your mass spectrometry data, the
peptides.txt
file from the
combined/txt folder can be directly used as input for Peptigram. No modification
needed.
Data from other peptide search engine and from de novo peptide sequencing
Currently Peptigram only supports output from MaxQuant/Andromeda. Should the user wish to analyse data from other peptide search engines or from de novo peptide sequencing tools (e.g. X!Tandem, SEQUEST or PEAKS) they will need to format their data file according to the column names outlined above. Peptigram input file requirements are flexible, if there is sufficient demand we may try to accommodate the output of other peptide search engines.
UniProt IDs
Peptigram relies on ProViz to retrieve the precursor protein sequence and associated data. Currently, ProViz only supports UniProt protein data meaning that Peptigram can only accept input with Uniprot IDs.
If your dataset contains proteins IDs from other database than UniProt, you can convert these IDs to UniProt's using their "Retrieve/ID mapping" tool.
Example
| Sequence | Protein | Start position | End position | Intensity s1 | Intensity s2 | Intensity s3 |
|---|---|---|---|---|---|---|
| YAKPAAVR | P02668 | 61 | 68 | 10217133333.0 | 0.0 | 5866233333.0 |
| VVPPFLQPEVMGVSK | P02666 | 98 | 112 | 0.0 | 15626666667.0 | 690976666.7 |
| YQKFALPQYLK | P02663 | 171 | 181 | 16302666667.0 | 115413333.3 | 0.0 |
| AASDISLLDAQSAPLR | P02754 | 25 | 40 | 101109333.3 | 677593333.3 | 15728000000.0 |
| IPAVFKIDALNENKVLVLDTDYKK | P02754 | 78 | 101 | 144627333.3 | 10271766667.0 | 6429900000.0 |
| TPEVDDEALEKFDKALKALPMHIR | P02754 | 125 | 148 | 17024000000.0 | 0.0 | 0.0 |
Summary table
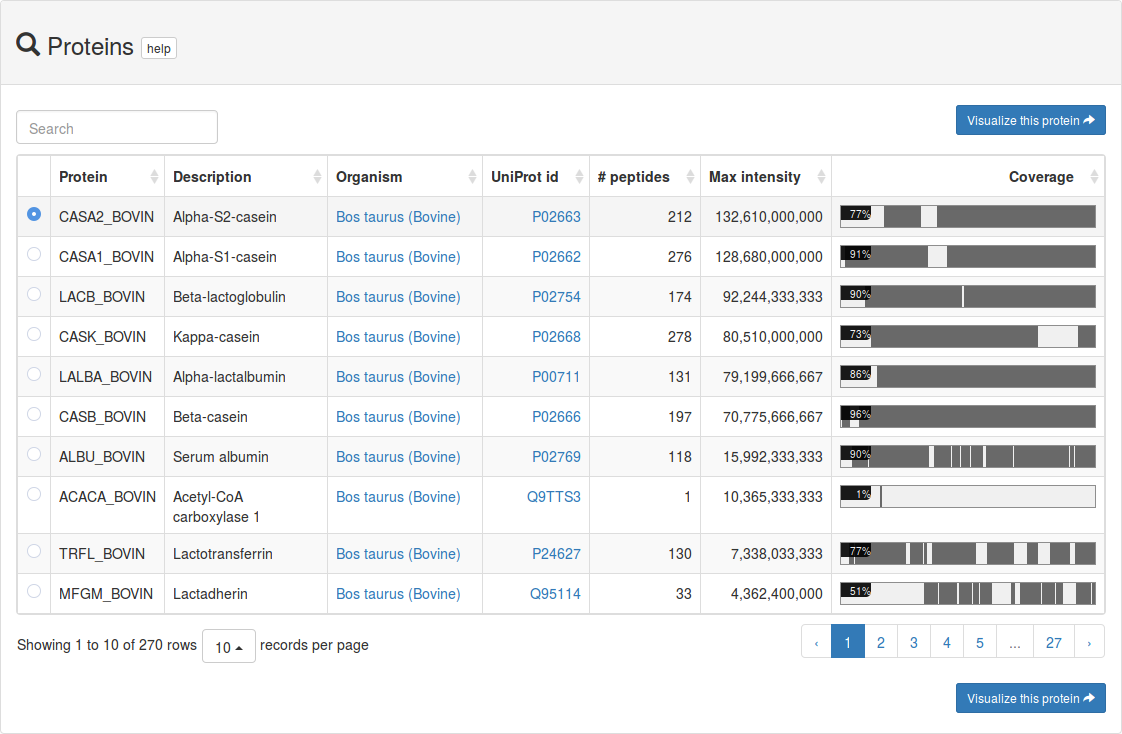
Once the data is uploaded and stored the user is automatically redirected to a summary page. At the top of this page a summary table is found, where each row represents a precursor protein. The table columns include the following information:
- Name of the precursor protein
- Description / common name of the protein
- Organism (linked to the NCBI taxonomy database)
- UniProt ID of the precursor protein (linked to UniProt)
- The number of unique peptides from this precursor protein across all samples
- Maximum peptide ion intensity across all samples for this precursor protein
- Peptide coverage (%), with a summary diagram of coverage. The grey zones represent regions of the precursor protein containing at least one peptide from at least one sample. White space indicates protein regions where no peptides were detected. Clicking on a grey zone redirects the user to the peptide alignment map for that protein region.
Every column in the summary table can be sorted. By default the table is sorted according to
the maximum peptide intensity for the data set. To save space the table spans over multiple
pages (if required). A search field is provided to locate specific proteins of interest. The
user can navigate to the peptide alignment map of any
protein by selecting the associated radio button (to the left) and pressing the Peptide
alignment map button.
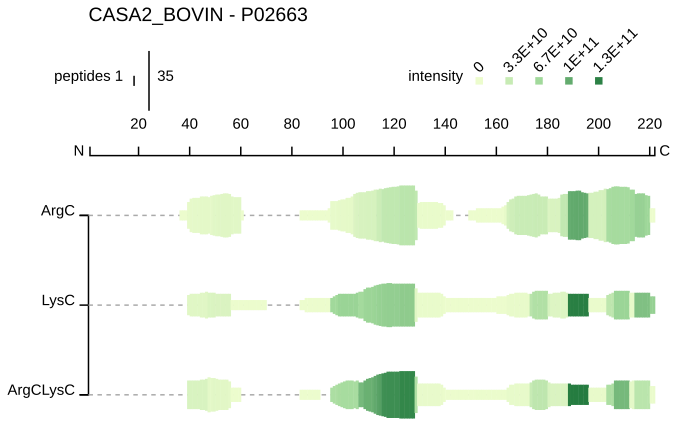
Peptide profile
Each sample is represented on a separate line. For each residue (on the x axis), a green bar is drawn if this position is covered by at least one peptide in the given sample. The height of this bar is proportional to the count of peptides overlapping this position. The colour intensity is proportional to the summed ion intensities of peptides overlapping this position, with dark green indicating high peptide intensity and light green indicating low peptide intensity.
The user can select which samples are displayed, as well as choose how to normalize the peptide intensities (either globally or per protein). The count of peptides overlapping a residue and the sum of their intensities is displayed by hovering over the bar. This visualisation can be downloaded as a SVG file.
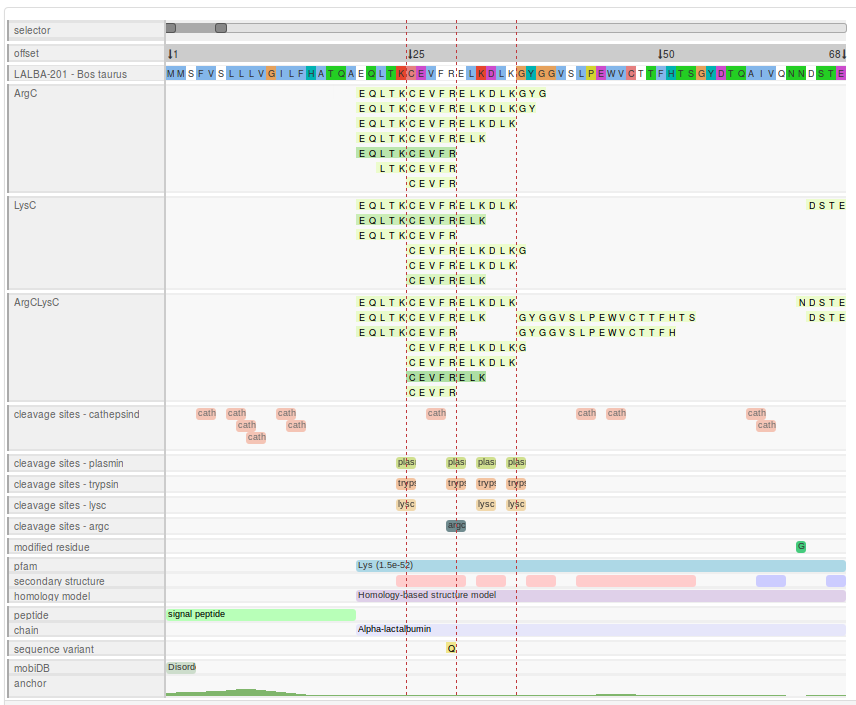
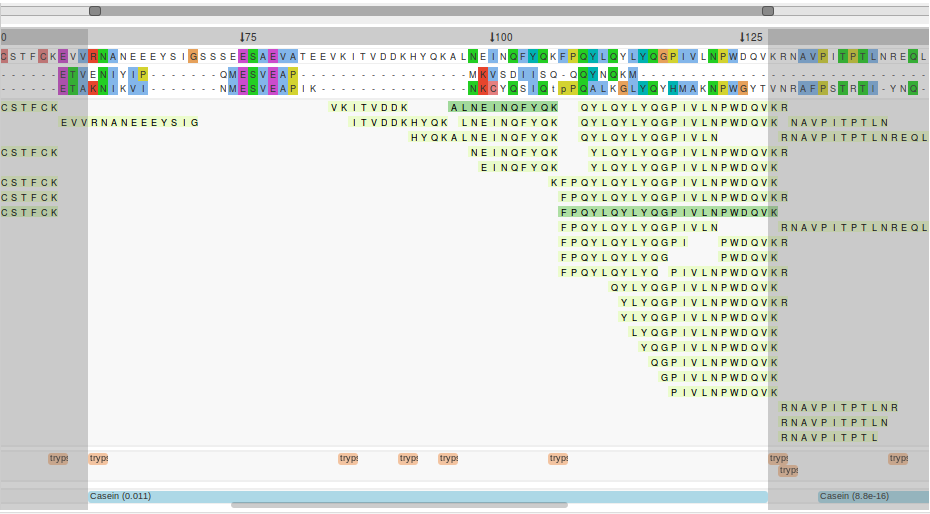
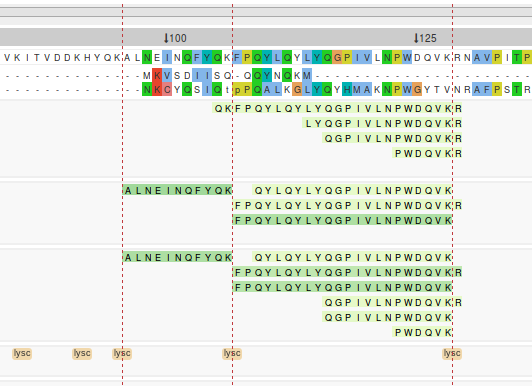
Peptide
                                alignment map
The peptide alignment map displays the precursor protein sequence with the detected peptides for each sample mapped to their associated position.
ProViz and precursor protein tracks
ProViz is used to build this visualisation and to retrieve relevant information from public sequence databases (e.g Pfam domains, modifications, known peptides etc.) A multiple sequence alignment for each precursor protein is supplied by a local version of ProViz, meaning at this time only GeneTree alignments containing Uniprot IDs are available.
In the peptide alignment map, separate tracks are included for the peptide profile of each sample, as well as for the alignment, various sequence features and for every peptidase (see below).
Sample tracks with mapped peptides
Each sample from the input data set is represented in a dedicated track. Peptides detected in a sample are displayed in green boxes, where the sequence of the peptide is overlaid. Each box is mapped to the relative position of the peptide within the precursor protein. The colour intensity is proportional to the detected ion intensity of the peptide. More information is available by clicking on a peptide box (see peptide information box).
Cleavage site tracks
Cleavage sites of common endopeptidases can be displayed in separate tracks (per endopeptidase). Each site is represented by a box (2 residues long) which overlaps the cleavage site. The colour of the box is peptidase specific and is consistent across the visualisation. Missed cleavage sites in the users data are represented by translucent boxes. Dashed red lines can be added to track the cleavage site across the entire visualisation (see cleavage site lines).
Interactivity
More information is displayed by hovering over each box. Peptigram is highly interactive and allows the user to select from various options to optimise their visualisation. All interactivity features are explained below.
The PDF button allows the user to download the visualisation as displayed on
screen (i.e. with the user selections/modifications if active).
Interactivity
Peptide information box
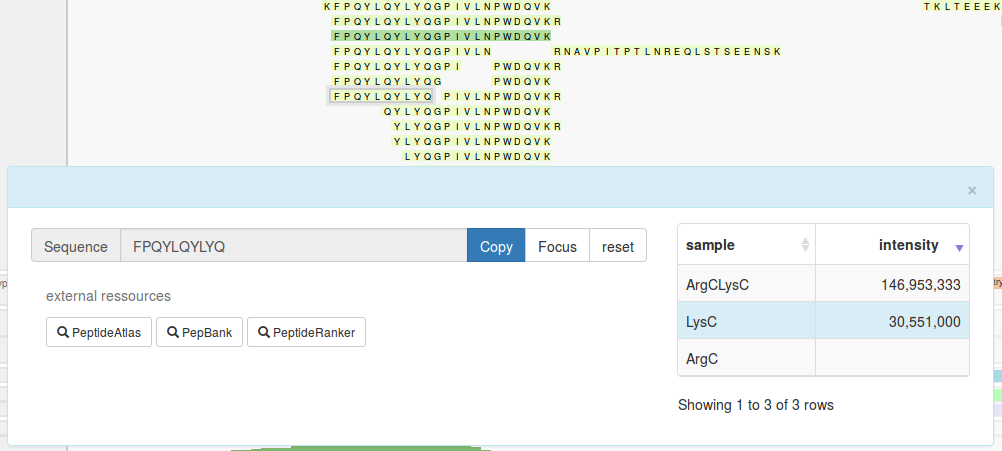
The "peptide information box" is displayed when you click on any peptide box of interest. On the left of this panel, there are options to copy the peptide sequence, highlight a vertical section of the visualisation relating to the peptide, and buttons to query the peptide in the following external tools:
- The peptide database PeptideAtlas
- The peptide database PepBank
- The bioactivity prediction tool PeptideRanker
On the right, a table summarises the intensities of the selected peptide in every sample. Here, the selected peptide is highlighted in blue. When a peptide is not present in a sample (as defined by the dataset) the intensity cell is left blank.
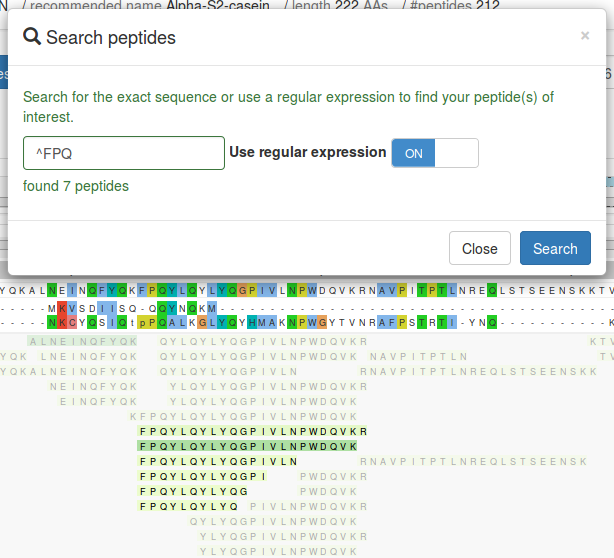
Search peptides
You can search for a specific peptide or multiple peptides using regular expressions via the
Search peptides
button. When the use regular expression switch is off only the exact input
peptide will be matched (if present). Peptides not matching the query are obscured to
highlight the matched peptides. The
reset
button — next to the
Search peptides button — resets the visualisation.
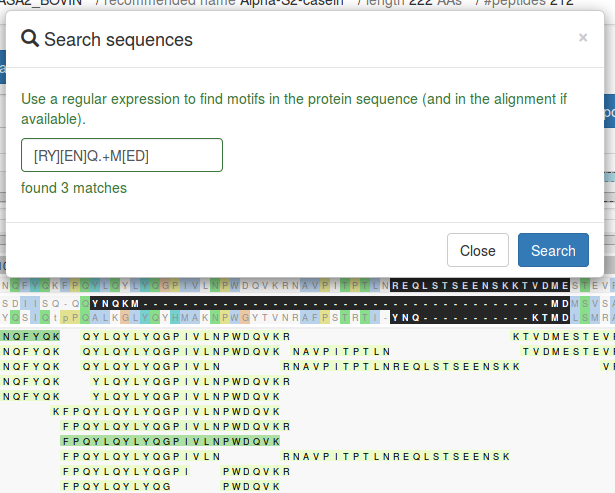
Search sequences
You can search for motifs in the precursor protein (and alignment where available) using
regular expressions via the
Search sequences button. The matching residues will be highlighted in bold. The
search is carried out on the actual sequence, meaning you don't need to account for indels (
-
). The
reset
button — next to the
Search peptides button — resets the visualisation.
Vertical selection of the visualisation
In order to focus on particular part of the visualisation, sub regions can be selected in a number of ways. The selected region remains visible, while the rest is obscured. This can be useful for interpretation when you have multiple samples and multiple data tracks. The different ways to select a vertical region are as follows:
- Use the
sliderabove the precursor protein sequence and then click on theFocusbutton - Directly input the residue positions of interest and then click on the
Focusbutton - Hold the ctrl key and click on a data box (e.g. a peptide box, a Pfam domain)

Resize the visualisation
If a user is only interested in a particular region of a protein the entire visualisation
can be resized accordingly. First, select a section — as described above — and
then click on the Resize button. This will redirect you to a new page, where a
peptide alignment map of only this sub region is displayed (with the default parameters).
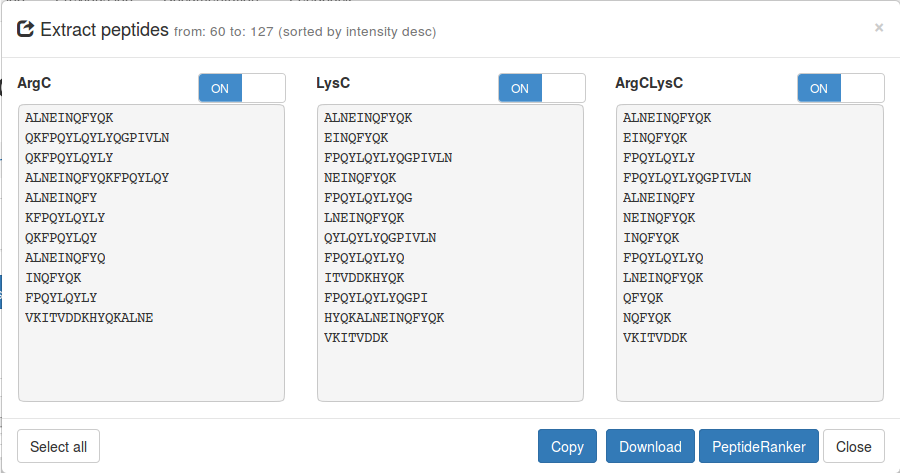
Extract peptides
From the whole precursor protein or from a selected part of
the protein you can extract peptides from all or a subset of samples. Click on the
Export
button and select Export peptides. From here you can directly copy the list of
peptides, download a text file containing these peptides or query them in
PeptideRanker .
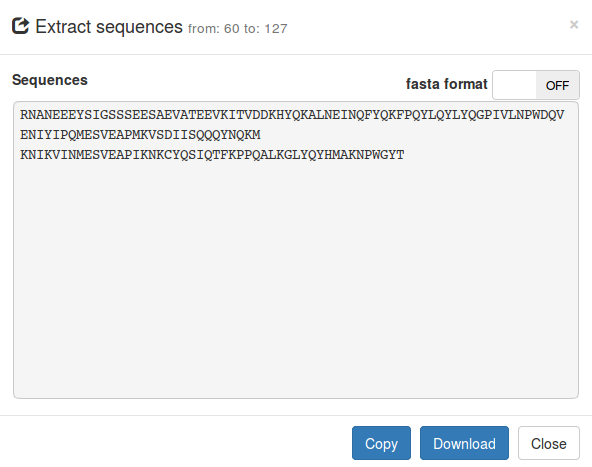
Extract sequences
From the whole precursor protein or from a selected part of
the protein you can extract part of the protein sequence or alignment (if
available). Click on the
Export
button and select
Export sequences . You can directly copy the sequences or download them as a
text file. Sequences can be extracted as is or in fasta format.
Settings and filters
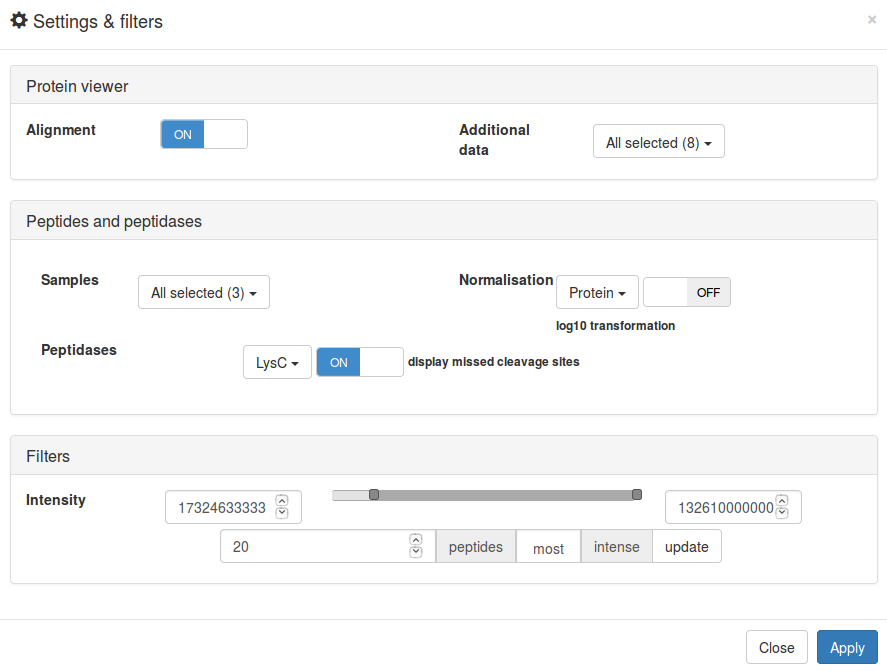
The
Settings and filters panel — available from the button of the same
name — allows the user to modify the peptide alignment map. Here, the user can alter
settings and filter peptides by intensity. Once the user has made their selections the
visualisation will be updated accordingly by clicking on Apply.
Protein viewer
If an alignment is available for your data, you may disable it should you wish to. All additional data tracks supplied by ProViz can be hidden also.
Peptides and peptidases
Peptigram displays a peptide track for each sample in the users data. The user has the
option to choose which samples to display and which to hide. This can be repeatedly modified
and updated as the user requires. The colour intensity of the peptide boxes is relative to
the peptide intensity. By default the colour gradient is based on the intensity of only
peptides detected for that protein (across all samples). From the normalization
list you can select to scale the gradient across all peptides in the entire data set.
By default only the Trypsin peptidase track is displayed. Other peptidase tracks can be
added by selecting them from a drop down list. Cleavage sites that don't match the N- or
C-termini of detected peptides are represented by translucent boxes. These can be removed
via the display missed cleavage
sites switch.
Filters
Intensity
Detected peptides can be filtered according to their intensity. To do this the user inputs
the minimum and maximum intensities of their choice or selects them via the slider buttons.
To implement their selection the user must then click on the Apply button.
Peptides outside the selected threshold will be hidden and only peptides within the selected
intensity range will be visible. Additionally, the user can select to display the
x most or least abundant peptides in their data by either inputting the value or
using the dedicated slider. Selections are applied by clicking on the update
button.
Cleavage site lines
Cleavage sites can be highlighted across the entire visualisation by clicking on peptidase
boxes of interest. Individual lines can be removed by clicking on the peptidase box a second
time. The hide cleavage lines button can be used to remove all the selected
cleavage site lines.
Overview box

Precursor proteins can be quite large, and often are too long to visualise in their entirety
on a computer screen. To account for this, the overview box allows you to quickly move along
the protein sequence (section by section) using the slider button. Equally, the
← and → buttons can be used to navigate along the
visualisation (the ← and → keys can also be used). The
dashed outline represents the part of the protein currently displayed on screen. When a
section of the precursor protein is selected (see Vertical
selection of the visualisation), t this is highlighted in grey in the overview box.
If the visualisation is resized, the removed sections are represented by the blue stripped
boxes.
Tutorial
How to create a new job?
- Ensure your input file conforms to the specifications
- Go to the new job page
- Select your input file
- Name your project (optional)
- Click on the
Submit jobbutton
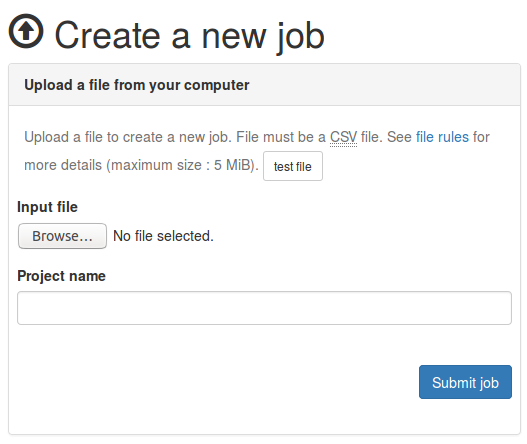
Upload form
How to cite peptigram?
Peptigram is currently developed by Jean Manguy from the Shields lab, UCD Conway Institute of Biomolecular and Biomedical Research; funded by Food for Health Ireland and by the Irish Research Council.
If you use Peptigram please cite the following article.
Legal
Peptigram is freely available for academic research. For other usages, please contact us.
End user licence agreement in preparation...
Cookies
Third party cookies
We are using Google Analytics to gather statistics about the uses of Peptigram.
- _ga
- The role of this cookie is to count the users and to distinguish the new users from the returning users.
Expiration: 2 years - _gat
- The role of this cookie is to survey the frequency of requests.
Expiration: 10 minutes.
Feedback
Find a bug, a typo? Have a feature request? Please create an "issue" on Bitbucket.
- version
- v1.0.1-b8cb639
Please describe your issue/request in as much detail as possible so we can identify and solve the problem quickly. You don't need to be registered on Bitbucket to create issues.
Peptigram works best with modern standard compliant web browsers If you are using Microsoft Edge or Internet Explorer, we strongly advise you to use another web browser like Firefox, Chrome or Opera.